Measuring AI Performance in Copilot Studio | Day 78
Measure Copilot Studio answer accuracy, task completion, groundedness, response time, reliability, satisfaction, and business value with a repeatable evaluation plan.
- Published
- Updated
- Reading time
- 11 min read
Quick answer
Measure AI performance by combining repeatable answer and task evaluations with published-agent outcomes, response times, reliability, feedback, and verified business results. Define success for each scenario, record a baseline, investigate failures, change one cause, and rerun the same tests before comparing operational results.
Week 12 · Day 78 of 365 in 365 Days of Copilot Studio — view the full series
Before you start
Is this guide for you?
- Best entry point
- 365 Days of Copilot Studio
- Time investment
- 11 min read
- Prerequisite knowledge
- Conversation analytics and metric definitions from Days 76 and 77, plus an agent with approved knowledge and a clear supported task.
What you’ll learn
- Usage indicates demand; successful answers and completed tasks establish usefulness.
- Evaluate correctness, relevance, completeness, and grounding separately.
- Confirm actions in the target system before counting tasks as completed.
- Report quality, latency, reliability, satisfaction, and value with their sample sizes.
- Compare the same scenarios before and after a change and inspect regressions.
Before you start
- Prerequisite knowledge
- Conversation analytics and metric definitions from Days 76 and 77, plus an agent with approved knowledge and a clear supported task.
On this page (15 sections)
Day 78 of 365 Days of Copilot Studio moves from reading conversation metrics to measuring whether an AI agent performs its intended work. A busy agent can still provide outdated answers, fail to create requests, or leave users repeating the same question.
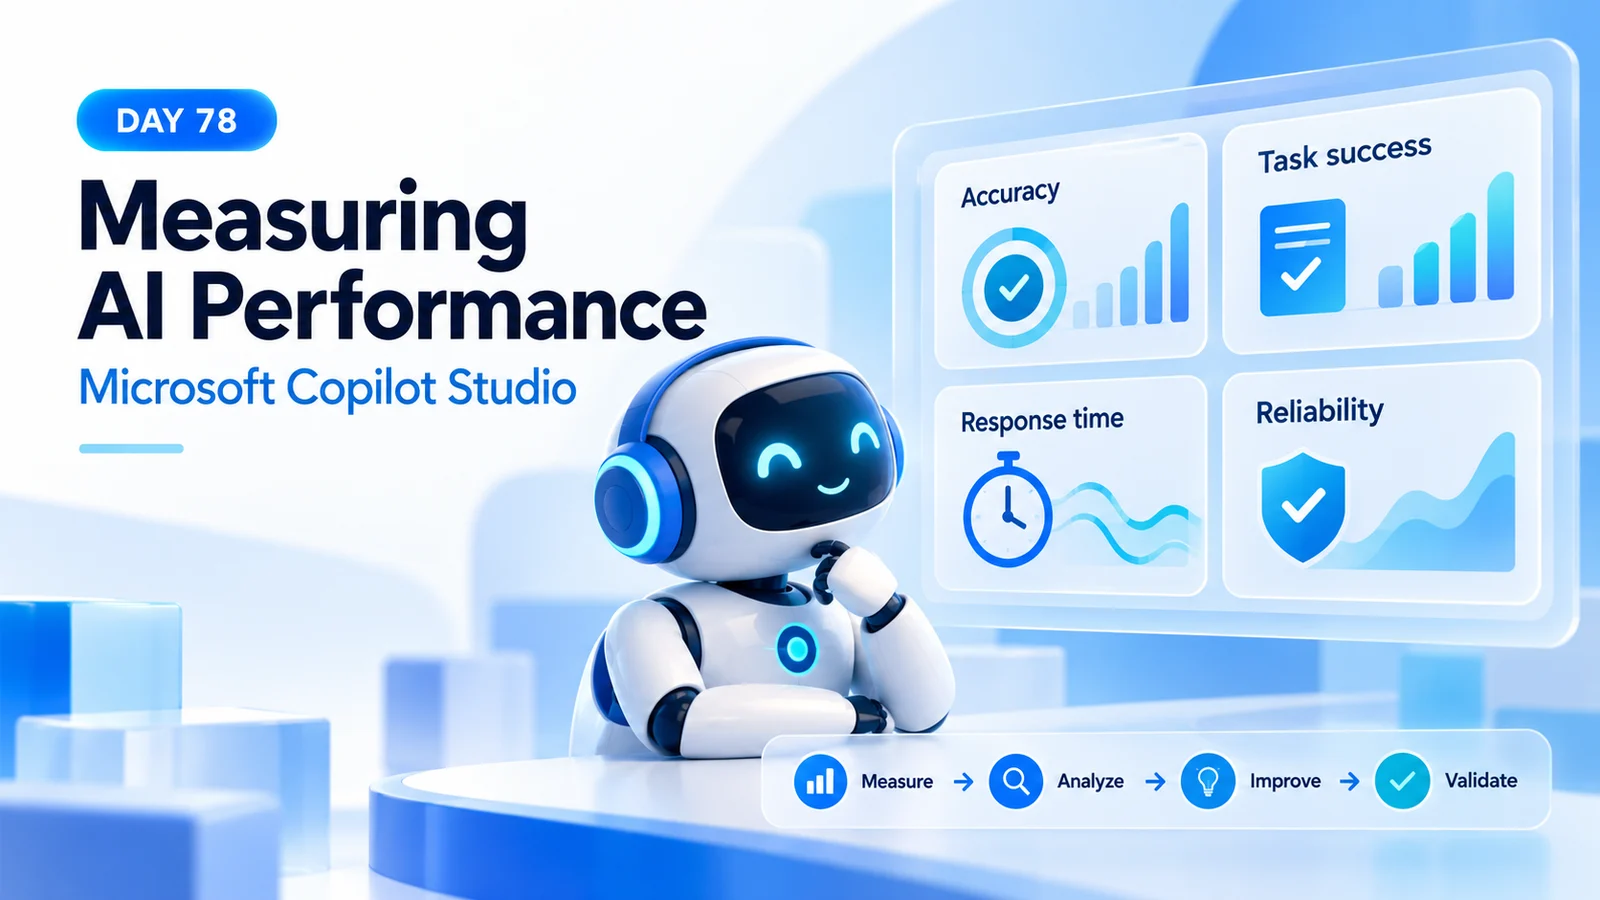
This lesson expands the Day 78 learning notes into a practical measurement plan: answer accuracy, task completion, resolution, response quality, speed, reliability, satisfaction, business impact, bottlenecks, and validation. The hero is a conceptual illustration. All numerical examples below are illustrative teaching data, not measurements from a nextM365 production agent or performance promises.
Use Day 76: Conversation Analytics for the review process and Day 77: Conversation Metrics for session definitions and denominators.
1. Define What Effective Performance Means
Start with a business task and an observable result. For an HR policy question, success means the employee receives the applicable approved guidance and a usable source. For a leave request, success means a valid request is recorded and the employee receives its reference and status. These are different outcomes and need different checks.
Write down the supported audience, channel, task, knowledge version, and required permissions. Agree on what should happen when information is missing or a request requires approval. An appropriate clarification or handoff can be the correct outcome.
| Dimension | Question to answer | Evidence |
|---|---|---|
| Answer quality | Is the answer correct, useful, and supported? | Approved reference and response review. |
| Task completion | Did the requested operation finish correctly? | Verified target-system state or receipt. |
| Reliability | Does the agent work consistently? | Repeat runs, tool outcomes, and error records. |
| User experience | Can people reach a useful result with reasonable effort? | Feedback, response times, and interaction review. |
| Business value | Did the workflow improve for its users? | Comparable time, cost, and outcome measurements. |
2. Separate Analytics From Evaluation
Operational analytics describes what happened in published interactions. A controlled evaluation asks how the agent handles a defined set of scenarios. Combine them: production patterns help select meaningful tests, and tests help reproduce the failures behind those patterns.
Microsoft describes agent evaluation as structured testing of responses against expected answers or quality standards. A repeatable set gives you a baseline when instructions, knowledge, or tools change. Automated assessment helps scale review; investigate important disagreements with a knowledgeable reviewer.
A test set also has limits. Ten clean policy questions cannot establish that a leave-request workflow works. Include the tasks, user contexts, and failure paths you actually need to support.
3. Measure Answer Accuracy Against Approved Facts
Accuracy asks whether the response is factually correct for the question and user context. Check dates, eligibility, amounts, exceptions, links, and instructions against the approved source. A confident tone and a citation do not establish accuracy.
For each question, record the expected facts and unacceptable mistakes. For example, a leave-policy answer might need to distinguish employee types and direct exceptions to HR. Review the applicable policy rather than expecting a single universal entitlement.
Reviewed-answer accuracy = correct reviewed answers / eligible reviewed answers × 100
Illustrative result: 46 / 50 × 100 = 92%
State what counted as correct, who reviewed it, and how the 50 questions were selected. If partially correct answers fail your rubric, apply that rule consistently. Separate factual errors from missing details so the repair addresses the cause.
4. Evaluate Relevance, Clarity, Completeness, and Grounding
Relevance asks whether the response addresses the question. Clarity asks whether a person can understand and use it. Completeness asks whether essential steps and qualifications are present. Grounding asks whether its claims are supported by the available context.
Imagine an employee asks how to submit leave for next Friday. A general paragraph explaining annual leave may be grounded yet fail to explain submission. A short answer with the correct process link and required steps may be more useful.
Check that cited sources support the actual claims and apply to the employee’s situation. A faithfully quoted obsolete document still creates an incorrect answer. Keep source maintenance and response assessment together.
Microsoft’s evaluation-method reference describes general quality, meaning comparison, tool use, and other methods for standard-harness agents. General quality assesses relevance, grounding, completeness, and whether an answer was attempted. Use an appropriate custom rubric for cases where refusal is expected. Available methods depend on the agent experience.
5. Verify Task Completion in the Target System
An action has several possible failure points: the agent may misunderstand the request, collect incomplete inputs, choose the wrong tool, encounter a connector error, or report success before the operation is confirmed. Assess the complete path.
- Define the requested operation and the necessary inputs.
- Run the scenario with an appropriate test account and test records.
- Check which tool executed and inspect its result.
- Verify the resulting record, dates, owner, and status in the target system.
- Check the confirmation shown to the user, including a usable reference.
Illustrative result: if 36 of 40 eligible request attempts create the correct record and return a valid confirmation, verified task completion is 90%. Record the four unsuccessful attempts by cause. Count a duplicate or incorrectly dated request as unsuccessful even if the connector returned a technical success.
Test interrupted requests and retries too. A user repeating “submit it” should not silently create a second request. Define how the workflow detects or handles duplication before using the completion figure as a release signal.
6. Read Resolution Alongside Verified Outcomes
Resolution describes the end of an analytics session. It provides useful context, but it does not independently prove that the answer was accurate or the task completed. Pair it with sampled answer reviews and action verification.
For a manually defined teaching cohort, 85 resolved sessions out of 100 eligible engaged sessions gives an 85% resolution proportion. Keep that denominator visible. When reproducing a product chart, use its documented definition and filters.
Investigate differences between session outcomes and verified tasks. If sessions look resolved while employees report missing requests, trace the action and confirmation. If escalation rises for requests requiring human approval, check whether that is the intended route.
7. Measure Response Time by Scenario
Measure how long a user waits for a useful answer or completed operation. Separate knowledge lookups from workflows involving several systems. Keep the timing boundary consistent, including whether completion means the first visible text or the final actionable response.
Report sample size, median, and a slower-tail measure such as the 95th percentile when you have enough observations. A single average can hide a small group of very slow requests. With a small sample, show the individual timings or range and avoid a broad latency claim.
Illustrative calculation: five lookup times of 1.8, 2.1, 2.4, 2.7, and 8.0 seconds have a median of 2.4 seconds and an average of 3.4 seconds. Inspect the eight-second request before deciding that every lookup needs optimization.
Microsoft’s evaluation-results guidance describes interaction response time as an end-to-end measurement that includes reasoning and tool or connector work. Timing is reported separately from pass/fail scoring. Set your own task-specific latency acceptance rule if speed matters to release readiness.
8. Check Reliability Across Dependencies
Reliability includes more than availability. An agent can be reachable while its most important action fails. Track availability, technical action success, verified task completion, and user-visible errors as separate measures with separate denominators.
| Signal | Illustrative definition | Investigation |
|---|---|---|
| Availability | Successful scheduled probes / attempted probes. | Channel access, authentication, and service reachability. |
| Technical action success | Successful tool calls / attempted tool calls. | Connections, permissions, validation, and dependencies. |
| Verified completion | Correct completed tasks / eligible task attempts. | Target-system data and end-user confirmation. |
| Repeat consistency | Acceptable runs / repeated runs of the same scenario. | Variation in facts, routing, and action behavior. |
For example, 972 successful tool calls from 1,000 attempts is 97.2% technical success. It does not mean 97.2% of users finished their task. Multi-call tasks, retries, and incorrect outputs make these populations different.
9. Use Satisfaction and Feedback as Diagnostic Evidence
Ratings reveal how respondents experienced the agent. Keep the number of responses beside an average and record how feedback was collected. A few enthusiastic respondents cannot establish satisfaction across the full audience.
An illustrative 4.6 out of 5 average is a rating on a scale. It is not a statement that 92% of users were satisfied. A satisfied-user percentage needs a defined rating threshold and the number of respondents meeting it.
Group comments into actionable themes: incorrect policy, missing link, repeated clarification, slow action, and unclear confirmation. Reproduce a theme with a concrete question before editing the agent. Confirm whether the issue belongs to the content, conversation, action, or downstream service.
10. Connect Performance to Business Value
Measure an actual workflow result, such as reduced handling time for verified requests or fewer repeat contacts for a supported issue. Compare similar tasks and include the human review, correction, and maintenance effort associated with the agent.
Illustrative workflow comparison:
Baseline handling time: 8 minutes per completed request
Agent-assisted handling time: 3 minutes per completed request
Comparable verified requests: 200
Gross handling time released: (8 - 3) × 200 = 1,000 minutes
Additional review and correction effort: 160 minutes
Net measured time released: 840 minutes = 14 hours
This estimate describes time released in the measured sample. It does not automatically represent cash savings or prove that the same result applies at every volume. Report the observation method, period, exclusions, and any change in workload.
11. Build a Small, Representative Test Set
Start with scenarios selected for business importance and observed failure patterns. Twenty thoughtful cases can be a useful starting point; they are not a universal adequacy threshold. Expand coverage as new tasks and failures appear.
| Scenario group | Illustrative cases | Expected behavior |
|---|---|---|
| Common questions | Five frequent policy questions. | Correct applicable facts and usable sources. |
| Language variation | Four paraphrases or short requests. | Preserved intent and correct routing. |
| Missing information | Three incomplete or ambiguous requests. | A focused clarification before action. |
| Task execution | Four valid requests with different inputs. | Correct verified records and confirmations. |
| Boundaries and recovery | Four permission, missing-knowledge, retry, or dependency cases. | Appropriate explanation, recovery, or handoff. |
Give each case an ID, expected behavior, reference source, user context, evaluation method, and severity. Keep reference facts versioned. Use controlled test data for actions and verify cleanup so repeated runs remain comparable.
12. Run a Baseline and Investigate the Failures
- Record the agent version, source versions, channel, test identity, and connection state.
- Open the agent’s evaluation experience, select or create the test set, and configure appropriate methods.
- Review expected answers and criteria before starting the run.
- Run the evaluation and inspect individual responses, evidence, and action results.
- Record failed cases separately from invalid tests or evaluation errors.
- Export or retain the evidence needed for the next comparison.
A teaching run might contain 17 passes and three failures out of 20 valid cases: 85%. If two of those cases instead produced evaluation errors, report the two errors explicitly and state the population used for any pass-rate calculation. Missing evidence is not a successful test.
Classify defects by cause. A missing source calls for content work; a wrong source may require knowledge scoping; a failed action may require connector or input validation work. Change the identified cause and retain the failure question as a regression case.
13. Compare Before and After Without Hiding Regressions
Rerun the same scenarios with the same rubric after a targeted change. Keep unrelated conditions as stable as possible. When a policy changes, update the expected facts deliberately and label that as a changed test baseline.
Illustrative comparison: 14 of 20 cases passed before a repair and 18 of 20 afterward. The pass rate rises from 70% to 90%, a gain of 20 percentage points. The relative increase is about 28.6%; name the calculation you use.
Compare individual cases as well as totals. Five repaired cases and one new regression produce a net gain of four passes, but the new regression still needs review. A serious permission or duplicate-submission defect should have its own release criterion even when the aggregate looks strong.
Repeat important scenarios to check variation, then examine comparable published usage after release. Controlled results and operational outcomes answer complementary questions.
14. Use a Practical Performance Review Checklist
- Scope: name the agent, task, channel, reporting period, user context, and release.
- Definitions: state every numerator, denominator, timing boundary, and exclusion.
- Quality: review factual correctness, relevance, clarity, completeness, and source support.
- Execution: verify target-system outcomes and test retries and failures.
- Experience: review response-time distribution, feedback, and repeated friction.
- Value: compare verified outcomes and include correction effort.
- Action: assign a specific repair, owner, and expected result.
- Validation: rerun the original failures, check regressions, and review follow-up usage.
Use the cycle from this lesson: measure, analyze, improve, validate. Keep a short change log linking the observed issue to the repair and its evidence. Over time, that record shows which changes made the agent more useful and which assumptions still need testing.
Practice: Create Your First Performance Scorecard
Choose one supported task and write its definition of success. Create a small set of common questions, variations, incomplete requests, and failure paths. Capture a baseline for answer quality and verified completion, then record response times and any available feedback separately.
Find one reproducible weakness, make a targeted correction, and rerun the same cases. Document the original behavior, the change, the new result, and any regression. You now have an evidence-based improvement record that connects agent behavior to the task it serves.
Tagged
AI Agents · Performance · Knowledge Sources · Generative AI
Frequently asked questions
Is a high resolution rate the same as high answer accuracy?
No. Resolution is a session outcome classification. Answer accuracy requires checking the response against approved facts and the requirements of the question.
How do I measure whether an agent completed a task?
Define the expected result, then verify the resulting record, state, or receipt in the target system. An agent saying that it succeeded is insufficient evidence.
Does a grounded answer have to be correct?
Grounding checks support in the supplied context. An answer can reflect a source faithfully while that source is outdated or inapplicable. Review source validity and applicability too.
What should I do when the evaluator disagrees with a reviewer?
Inspect the question, expected answer, rubric, retrieved evidence, and actual response. Correct the test or agent as appropriate, preserve the rationale, and rerun the case.
What is a good response-time target?
Set a target for the task and channel using a measured baseline and user expectations. Report typical and slower interactions; a simple knowledge lookup and a multi-step action need different budgets.
How often should I evaluate my agent?
Rerun relevant scenarios after changes to instructions, knowledge, tools, authentication, or models. Review production patterns on a cadence suited to usage and add recurring failures to the regression set.
Sources
- About agent evaluation — Microsoft Learn, Microsoft, accessed 2026-10-15
- Choose evaluation methods — Microsoft Learn, Microsoft, accessed 2026-10-15
- Run evaluations and view results — Microsoft Learn, Microsoft, accessed 2026-10-15
Have a Microsoft 365 topic idea?
Share article suggestions, community session ideas, corrections, or real-world scenarios for future nextM365 learning notes.
Keep learning Microsoft 365
Explore more practical guides for SharePoint, Power Platform, Copilot Studio, migration, automation, governance, and security.
Continue learning
Related tutorials
Related questions
Related comparisons
Next action